title: "R-ATCHE-3(S)"
draft: true
Acid + Base
pH Scale
- The pH scale is a measure of the concentration of hydronium ions in solution and it is an inverse logarithmic scale.
- $pH = -\log[H_{3}O^{+}]$
- This linearises the scale, because there can be very low concentrations and very high.
- The pH of water of a neutral solution at $25 \degree C$ is 7.0, the pH of an acidic solution at $25 \degree C$ is less than 7.0, and the pH of a basic solution at $25 \degree C$ is more than 7.0.
- Notes:
- The pH scale ranges from a little below -1 to slightly above 15.0
- A change of one pH unit represents a tenfold change in hydrogen ion concentration.
Buffer Graphs
- Very important when starting to do titrations.
When analysing a buffer system we must graph pH on y-axis and volume of acid/base added on x-axis
- Here since we are adding a base: the buffer pH increases (see graph)
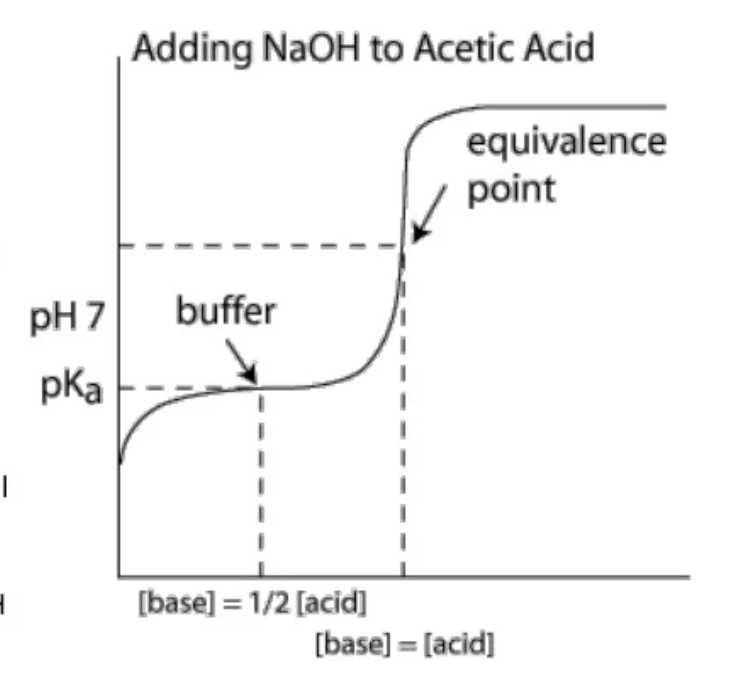
- Assume we are adding 1.0 molL-1 base NaOH to a weak acid. The buffer curve exists with 3 specific parts:
- The initial buffer pH is around 3 and nothing has been added - this is where the concentration of hydronium is maximum
- The slanted curve: here as NaOH is being added, the concentration of hydronium and ethanoic acid start to decrease. However as buffer resistance changes in PH to a significant extent, the pH change is very minimal proportional to the volume of added base
- At the end of the slanted curve, pH starts to rise at a high rate: here the buffer capacity is exhausted, thus pH rises much more quickly
- The midpoint - at the point where the amount of base added equals exactly half of the concentration of the acid present - the moles of $CH_{3}COOH$ and $CH_{3}COO^{-}$ are equal.
Buffer Capacity
Definition: Buffer capacity is the ability of a buffer solution to neutralise excess acid or base without any appreciable change in its pH. It is also defined as: the amount of strong acid/base that can be added to a buffer solution before a significant change in pH will occur.
Factors affecting buffer capacity:
- High concentration of components
- For a high buffer capacity, weak acid + bases must have high concentrations so neither is significantly depleted when a strong acid or base is added.
- Equal concentration
- Buffer capacity is highest when there are equal concentrations of acid and conjugate base or base and conjugate acid, as this means the buffer solution can deal with the addition of both strong acids or bases.
Buffer Capacity
 Representation on Graph
-
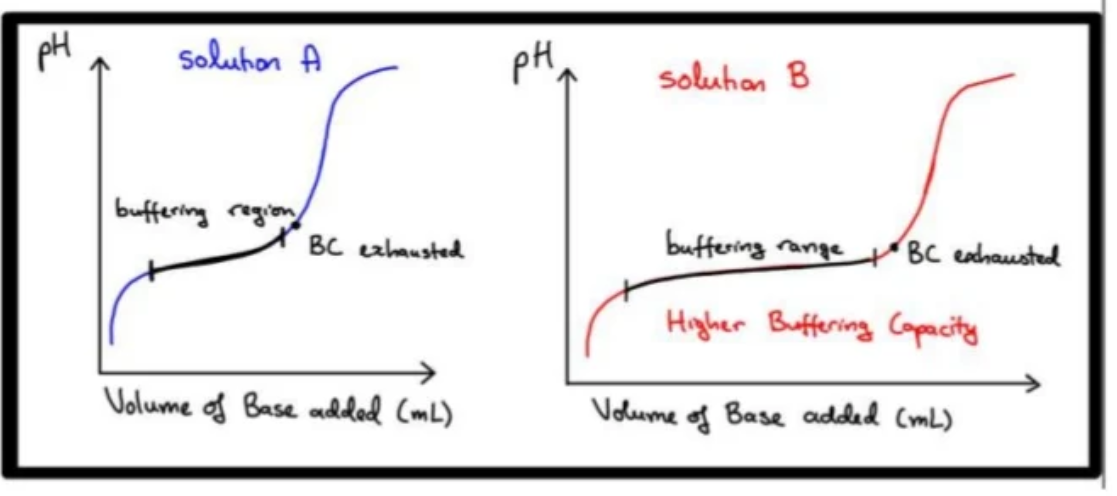
If solution B contains double the concentration of the weak acid/conjugate base that is being used to make a buffer as compared to solution A (whilst ensuring weak acid and conjugate base concentrations are equal)
-
The volume of strong acid/base that can be added before a significant pH change occurs(i.e. buffer capacity/regional buffer capacity) is increased
Polyprotic acids
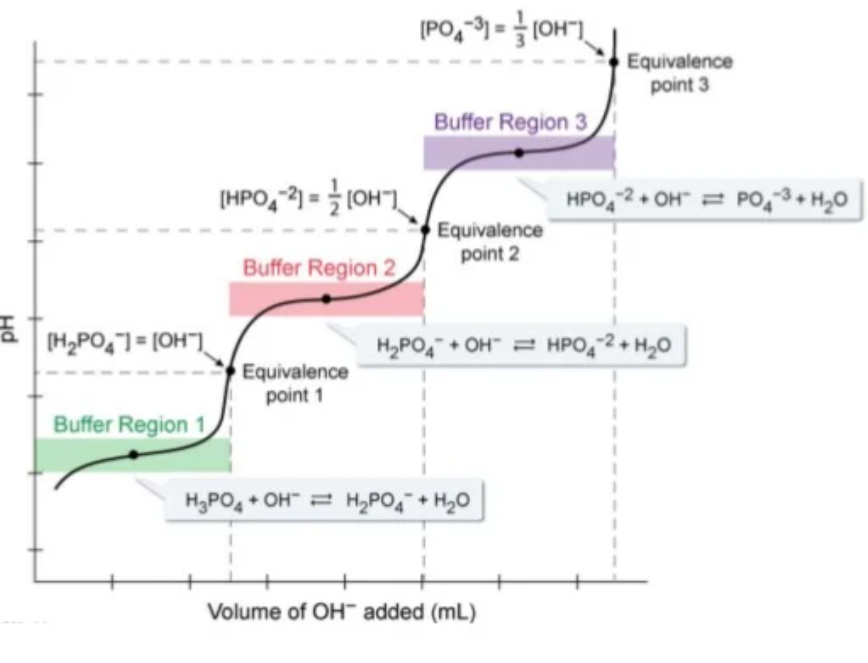
Think of polyprotic acids as multiple buffer systems.
Weak polyprotic acids can buffer at different pHs. This is because they ionize to produce another weak acid/conjugate base to a weak acid.
- Consider buffer region 1 - as $OH^{-}$ is added, phosphoric acid is consumed and $H_{2}PO_{4}^{-}$ is formed. Thus the addition of $OH^{-}$ will be partially counteracted and a pH increase resisted.
- This will continue until the buffer is exhausted and then pH will increase significantly for small volumes of $OH^{-}$ added.
- However, once enough $OH^{-}$ is added, all the phosphoric acid will have been consumed, large amounts of $H_{2}PO_{4}^{-}$ have been formed.
- This increase in the concentration of $H_{2}PO_{4}^{-}$ will cause the concentration of $HPO_{4}^{2-}$ as equilibrium two shifts right and so $H_{2}PO_{4}^{-}$ concentration will partially decrease. This will continue until the two are roughly equal - another buffer has been established.
- This buffer will resist changes in its pH as more base is added as shown by buffer region 2.
- THIS CONTINUES until at the very end only phosphate ions remain.
Titrations
Indicators
Have patience. Do it drop by drop. The equivalence point is very sensitive to volume change, so one drop could ruin your titration!
Indicators used in acid-base titration are large/complex organic molecules that are either weak acids or bases which:
- Have different structures and different colours in their protonated and deprotonated forms
- Change colour over a narrow pH range as their molecular structure changes (due to them gaining or losing protons in an acid/base solution)
- Have an equivalence point - a point in a titration where the amount of titrant added is enough to completely neutralise the analyte solution.
How do indicators work?
- Indicators used in acid-base titration are weak acids or bases which have different structures and different colours in their protonated and deprotonated forms and thus change colour over a narrow pH range.
- The general equilibirum of indicators in solution is shown below:
- $HInd + H_{2}O \rightleftharpoons H_{3}O^{+} + Ind^{-}$
- When some acid is added NEAR the equivalence point (i.e. the point where roughly equal $H^{+}$/$OH^{-}$), the concentration of $H^{+}$ increases rapidly and the equilibrium shifts left and so the [$Hind$] increases and [$Ind^{-}$] decreases and the indicator changes colour from that of the $Ind^{-}$ ion to $Hind$.
- When some base is added NEAR the equivalence point, the concentration of $H^{+}$ decreases rapidly and the equilibrium shifts right so the [$Ind^{-}$] increases and the [$HInd$] increases and the indicator changes colour from that of the $HInd$ ion to $Ind^{-}$.
- Note: Acid form of the indicator is represented by $HInd$, and the conjugate base is $Ind^{-}$.
- We use Ind because the actual indicator is much more complex.
Indicators to memorise
- Phenolphthalein - colourless when acid, pink when base
- Methyl Orange - red when acid, yellow when base
Titration Curves
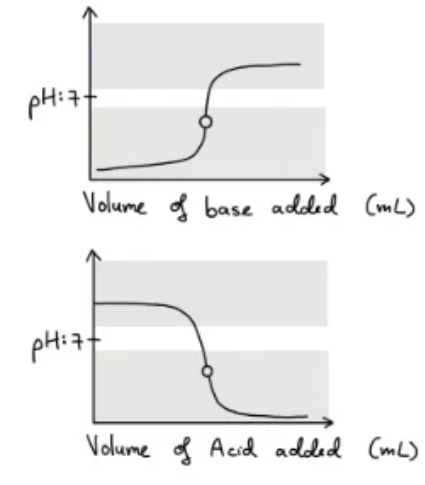
A titration curve is the plot of the pH of analyte solution versus the volume of the titrant added as the titration progresses.
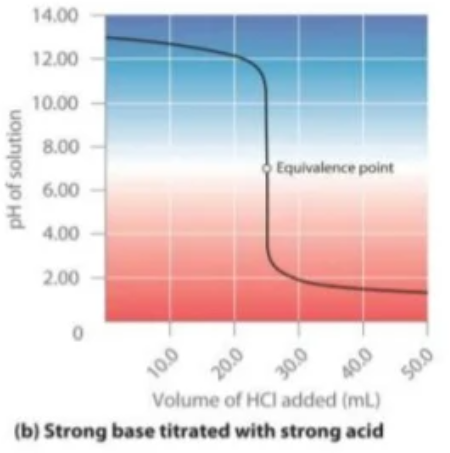
Strong acids and bases
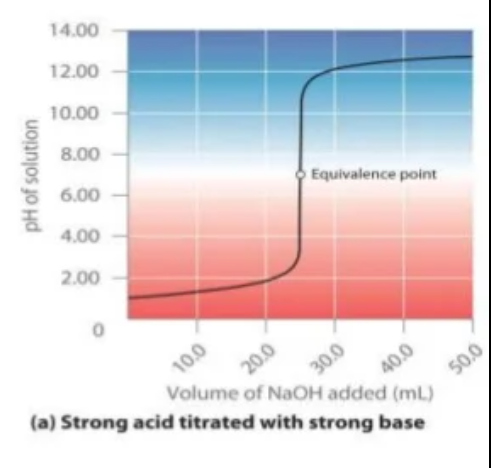
- When a strong acid is titrated with a strong base the equivalence point occurs at a pH of 7 due to the presence of neutral ions which dont undergo hydrolysis.
- The curve has a sharp increase/decrease of pH meaning any indicator can be used which changes colour and has an end point over a pH of 4-10.
- As the pH changes drastically with very small volume of acid/base added, an indicator within an endpoint range of 4-10 will indicate a volume very true to the true volume.
- However we try and use indicators that have an end point near a pH of 7 to further try and reduce the 'titration error'
- As a result, methyl orange and phenolphthalein is suitable!
Strong acid - weak base
- When a strong acid is titrated with a strong base, the equivalence point will be below a pH of 7 as the solution is acidic due to the ions of the weak base (strong conjugate acids) hydrolysing with water to produce hydronium ions.
- The pH of this curve stays relatively constant after an initial sharp increase/decrease until it approaches the equivalence point where the pH decreases/increases sharply.
- Therefore, to obtain a correct reading of the volume of the acid added, the indicator needs to change colour at a pH less than 7 - thus methyl orange is suitable
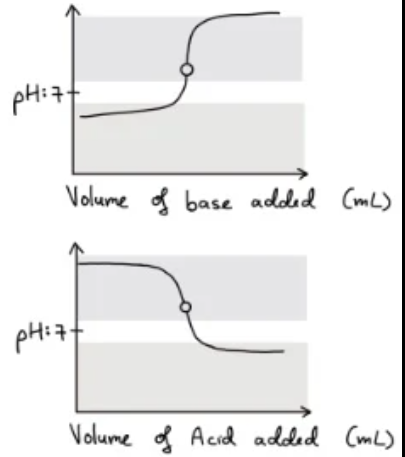
Weak acid - strong base
- When a strong base is titrated with a weak acid the equivalence point wil be greater than 7 as the solution is basic
- The anion of the weak acid (strong conjugate base) will hydrolyse water to produce hydroxide ions.
- The pH of this curve stays relatively constant but decreases/increases sharply near the equivalence point
- To obtain a correct reading of the volume of the acid added, the indicator needs to change colour at a pH greater than 7 (range of 8-9) making phenolphthalein suitable.
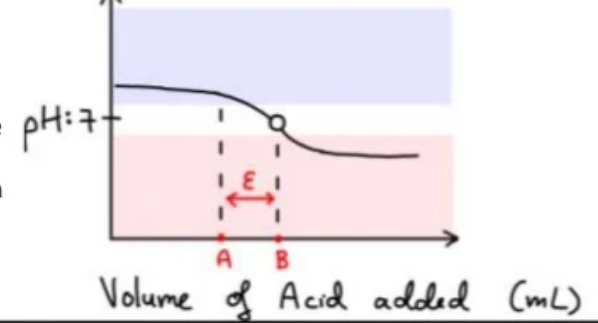
Weak acid - weak base
- When a weak acid and weak base are titrated against each other, a reaction doesn't go to completion and there is no sharp end point.
- This means the equivalence point cannot be accurately determined as the indicator would have to have a very specific pH range.
- Here we use back titrations. Furthermore, the pH of the equivalence point can be more or less than 7 based on the relative acid/base strength of the ionic salt formed.
- The indicator starts changing colour at A(transition of colour is starting) and so the end point occurs at A. However the equivalence point is occurring at B. This means that there is a significant titration error. ($\epsilon$)
End Point and Equivalence Point
- The equivalence point of a titration is the point in the titration when stoichiometrically equal moles of acid and base have been added
- The end point of a titration is the experimentally determined point at which the completion of the reaction is marked by some signal.
- Alternative: The end point is the colour change in the indicator which indicates when the equivalence point has been reached and the titration should be stopped. It is a very close approximation of the equivalence point.
- Titration error is the difference between the equivalence point and the measured end point.
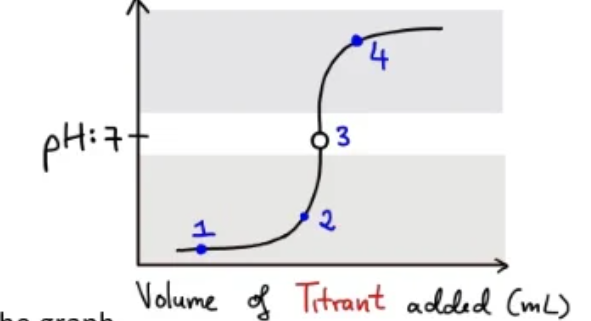
Points about the graph:
- (1) No base has been added: predominant species is $H^{+}$
- (1) to (2) As there is an excess of $H^{+}$, the $OH^{-}$ added is neutralised and so pH rises very slowly
- (3) equivalence point: the amount of $OH^{-}$ added is exactly equal to $H^{+}$ present in solution
- (4) Here the solution is basic as there is a large excess of $OH^{-}$
Choosing an Indicator
- The indicator used has to have an end point colour change at or near the equivalence point to reduce errors
- Otherwise, more or less of the acid/base would have to be added to result in a colour change that is required to reach the equivalence. If more of the titrant is added, concentration calculated will be lower and if less is added, concentration calculated will be greater.
Good Acid-Base indicators have the following properties:
- Have a distinct noticeable colour change
- Change colour over a narrow pH range
- Have an endpoint range that is near to our equivalence point.
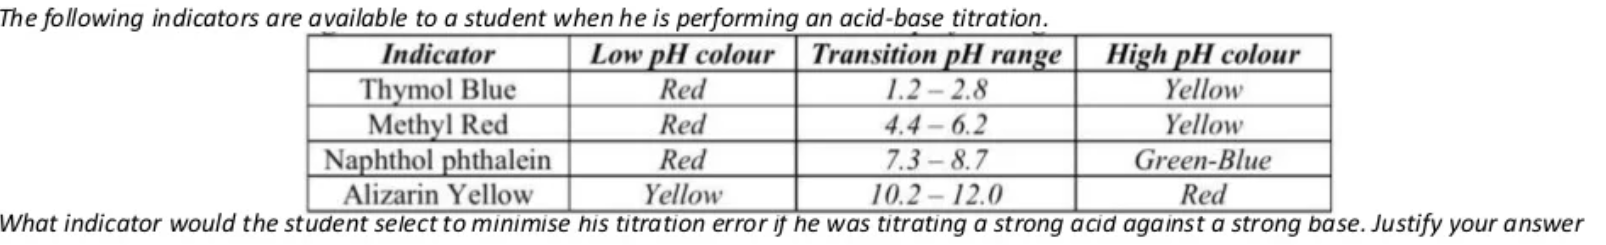
Practice Question
 (4 marks)
Practice Question Answer
- When titrating a strong base and a strong acid, the salt produced will dissociate into ions that do not undergo hydrolysis with water and are thus neutral. Therefore the pH of the resulting solution will be very close to or equal to 7.
- Therefore an indicator with an endpoint range near the equivalence point is required as this will signal a colour change as close to the equivalence point as possible and thus decrease the difference in the volume of acid/base added and the volume required to be added to reach equivalence point (the titration error)
- Thus the Naphthol phthalein indicator should be used.
- The other indicators have an end-point that is much higher or lower than the equivalence point and so these indicators will change colour too early or too late resulting in the volume of acid/base being added to be more/less than required and thus the concentration calculated to be inaccurate.
Volumetric Analysis Definitions
Volumetric analysis: the process of determining the concentration of a sample by measuring the volume of the same sample that reacts with a known volume of another substance of a known concentration
- Titration: A type of volumetric analysis that determines the concentration of the unkown substance by determining the equivalence point
- Analyte: A solution of unknown concentration being analysed
- Aliquot: An accurately measured volume of a solution of known concentration.
- Titrant: The solution in the burette and the volume used to reach the endpoint. The titre values should be within 0.2mL of each other.
Equipment:
- Volumetric flask: Used to create known concentration of primary standard. Mass of primary standard (e.g. $Na_{2}CO_{3}$) and distilled water added. Rinsed only with distilled water so number of moles of $Na_{2}CO_{3}$ doesn't change
- Burette: Typically used to add the acid of unkown concentration to the primary standard. Rinsed with water and the acid solution so the concentration of acid doesn't change
- Pipette: Typically used to add exactly 20mL of primary standard solution to conical flask. Rinsed with water and then primary standard solution concentration doesn't change
- Conical flask: Used to hold the primary standard solution and indicator while solution of unknown concentration is added from the burette. It is only rinsed with water so the numbe of moles of primary standard added doesn't change
- Storage vessel: Used to store primary standard solution. Rinsed with water and the primary standard solution - this is done so concentration of primary standard doesn't change
- Beakers: Used to hold analyte. Rinsed with water and then the solution of analyte so concentration doesn't change.
Primary Standard Solutions
Primary Standard
- A primary standard is a substance that is very pure and for which the amount (in moles) can be very accurately determined from its mass. Primary standards can be used to produce a pure solution of known concentration.
- This is the primary standard solution - a solution of accurately known concentration that remains stable for extended periods of time. It is used to find the concentration of other reagents.
Requirements - these requirements of the primary standard allow the primary standard to be precisely calculated from its accurately measured mass and molar mass.
- Primary standard needs a relatively high molar mass - so that reasonable amount of mass can be measured when creating the primary standard solution giving smaller uncertainty.
- Primary standard must have high purity - no side reactions occur when added to acid or base
- Primary standard must be anhydrous - usually heated to remove water of crystallisation.
- Primary standard must dissolve readily in solvent, typically water
- Primary standard must be stable in the presence of air - so it doesn't react with $CO_{2}$ or absorb water
Primary Standard Solutions
- A solution of accurately known volume and concentration prepared by weighing a given mass of primary standard (which has been heated so it is anhydrous), adding the primary standard to a 250mL volumetric flask (that has been rinsed with distilled water) and mixed up to 250mL with distilled water, ensuring all solids are dissolved.
Suitable and Unsuitable Primary Standards
Suitable Primary Standards
- Sodium Carbonate ($Na_{2}CO_{3}$)
- Oxalic Acid ($H_{2}C_{2}O_{4}.2H_{2}O$)
Unstable Primary Standards
- $HCl$
- It exists as a gas, so a pure dry sample of known mass can't be obtained and dissolved in a specific volume of solution so they can't be made to an accurately known concentration
- $H_{2}SO_{4}$, $NaOH$
- These substances are deliquescent/hygroscopic. They absorb moisture from the air and absorb water from the atmosphere and thus their mass cannot be measured accurately. Difference between deliquescent and hygroscopic is that deliquescent substances absorb so much water that they become liquids.
- $NaOH$ also reacts with $CO_{2}$ in the air forming $Na_{2}CO_{3}$ and $H_{2}O$.
Practice Q: Is the primary standard suitable?
- Oxalic acid pentahydrate ($H_{2}C_{2}O_{4}.5H_{2}O$) is a primary standard used to produce many primary standard solutions. List three properties of oxalic acid that makes it a good primary standard
(Answer)
- Has a relatively high molar mass enabling a greater accuracy in determining concentrations
- Highly soluble and is obtained with a high degree of purity
- It does not absorb moisture and does not react with any gases in the air when exposed therefore maintains a stable concentration
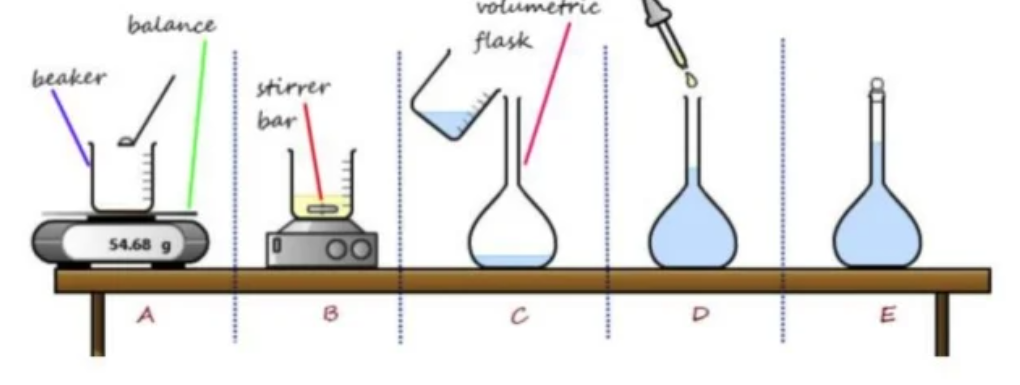
Preparing Primary Standard Solutions
- The primary standard is usually heated to make it anhydrous and then it is weighed - this mass is recorded
- The solid is then transferred into the volumetric flask - a dry funnel is used to restrict runoff.
- We rinse any of the remaining of the solid particles into the flask using deionized water - this is very important to prevent the loss of any primary standard (this would completely wreck our titration calculations)
- We then add distilled water to the volumetric analysis flask up to the calibration point (this is to ensure we have just enough water volume) - now we place a stopper and shake the solution the ensure an even concentration throughout
Result - the result of this redious method is a homogenous (even concentration throughout) solution for which the concentration is very accurately known.
Preparing a primary standard Q
- A student was asked to prepare a standard solution of oxalic acid of approximate concentration (0.10 $molL^{-1}$). The equipment is as follows:
- Distilled water
- Weighing boats
- Wash Bottle
- Stirring Rod
- Electronic Balance
- Volumetric flasks (250ml and 500ml)
- Oxalic Acid : 15h
- Beakers (20ml, 50ml, 100ml, 250ml)
Give a step-by-step description of the procedure for preparing the standard oxalic acid solution. Perform all necessary calculations
Q answer
Calculation
- Determine the mass of oxalic acid you need to add, literally use n=cv then n=m/M, we know everything other than m, solve for m
Procedure
- Transfer the powder into a 50.0 mL beaker, stir the mixture in the beaker to dissolve all the solid particles of the acid.
- Transfer the solution into a 500mL volumetric flask which is clean and dry. Wash the beaker with some distilled water a few times and transfer all the washings into the flask.
- Nearly half-fill the volumetric flask with distilled water. Closing the lid tightly and invert the flask a few times to make sure that all the solid is dissolved.
- After the bubbles disappear, fill the flask up to the mark in the neck of the flask with a teat pipette until the lower level of the concave meniscus levels with the mark on the neck
- Transfer the standard oxalic acid solution into a reagent bottle and label the bottle with the concentration and the date prepared.
Titration Errors:
(Base primary standard, acid analyte)
- Error 1: Pipette Rinsed with distilled water
- If the pipette is rinsed with distilled water before transferring standard solution to a volumetric flask, it dilutes the concentration of the standard solution it is transferring.
- This decreases the moles of NaOH present in the volumetric flask and so the moles and thus volume of ethanoic acid that is added to the volumetric flask to achieve equivalence point is lower than if correct rinsing technique was utilised
- Therefore the calculated concentration of the ethanoic acid is high (as $c = \frac{n}{v}$, $v \downarrow$) than the true value
- Error 2: Burette rinsed with distilled water
- If the burette is rinsed with distilled water before some ethanoic acid is added to it, this decreases the concentration of the ethanoic acid solution in the burette
- Thus as the moles of the ethanoic acid required to neutralise the NaOH aliquot is exactly the same as before (because the moles of NaOH in the conical flask is unchanged) the volume of ethanoic acid added increases (as the ethanoic acid is diluted)
- Thus the calculated concentration of the ethanoic acid is lower than the true ethanoic acid
- Error 3: Conical flask rinsed with standard solution
- If the conical flask is rinsed with PSS than the moles of the NaOH in the solution present in the conical flask increases and so the concentration of solution in the conical flask is higher.
- Therefore the moles and thus volume of ethanoic acid solution that will be released from the burette to achieve equivalence point will be higher than if correct rinsing techniques was applied
- Thus the calculated concentration of the ethanoic acid solution will be lower than true concentration of the ethanoic acid solution.
- Error 4: Methyl orange used instead of phenolphthalein
- Ethanoic acid is a weak acid and is being titrated with a strong base so the solution at equivalence point will be basic.
- If methyl orange is used instead of phenolphthalein, the endpoint would occur before the equivalence point is reached
- The volume of ethanoic acid added will be lower than if the correct indicator was used and thus the concentration of ethanoic acid will be calculated as being higher than the true volume.
- Error 5: NaOH used to make pimary standard solution
- It is known that NaOH is hydroscopic and absorbs moisture from the air. Thus the mass of an NaOH sample also includes the mass of some water.
- Therefore when the NaOH sample is dissolved, the moles of NaOH dissolved in a given volume of water will be lower than calculated as the sample of NaOH being used has some water making a part of its mass and so the concentration of the NaOH will be lower than if the NaOH solution was standardised against another PSS.
- Thus the volume of ethanoic acid will be lower and so the concentration of ethanoic acid will be calculated as being higher than the actual value.
- Error 6: Volumetric flask not filled to mark for PSS
- If the volumetric flask is not filled with water to the mark when making the PSS, the concentration of the PSS solution is higher than calculated, thus calculated, thus concentration of NaoH is higher than calculated
- Thus the volume of ethanoic acid added will be higher than if a correctly produced PSS was being used
- Thus the calculated concentration of the ethanoic acid will be lower as $c=\frac{n}{v}$ and a larger volume has been added.
- Error 7: Titration stopped as soon as first colour change occurs
-
If the titration is stopped at the first colour change, the end point has not completely been reached and the pH of the solution is just reaching the end point range.
-
Thus if the titration is stopped early, the amount of ethanoic acid added will be lower than if a complete colour change was being achieved
-
Thus the calculated concentration of ethanoic acid will be higher than the true value.
This is a general way to answer such questions. Some logic may be required if test questions are changes slightly.